Scene-backed scans, before the hardware ships.
Build a scene, point a virtual UST-10LX at it, and capture deterministic scan data. Use it to develop ingestion code, exercise edge cases, or stand up a demo without waiting for a sensor seat.
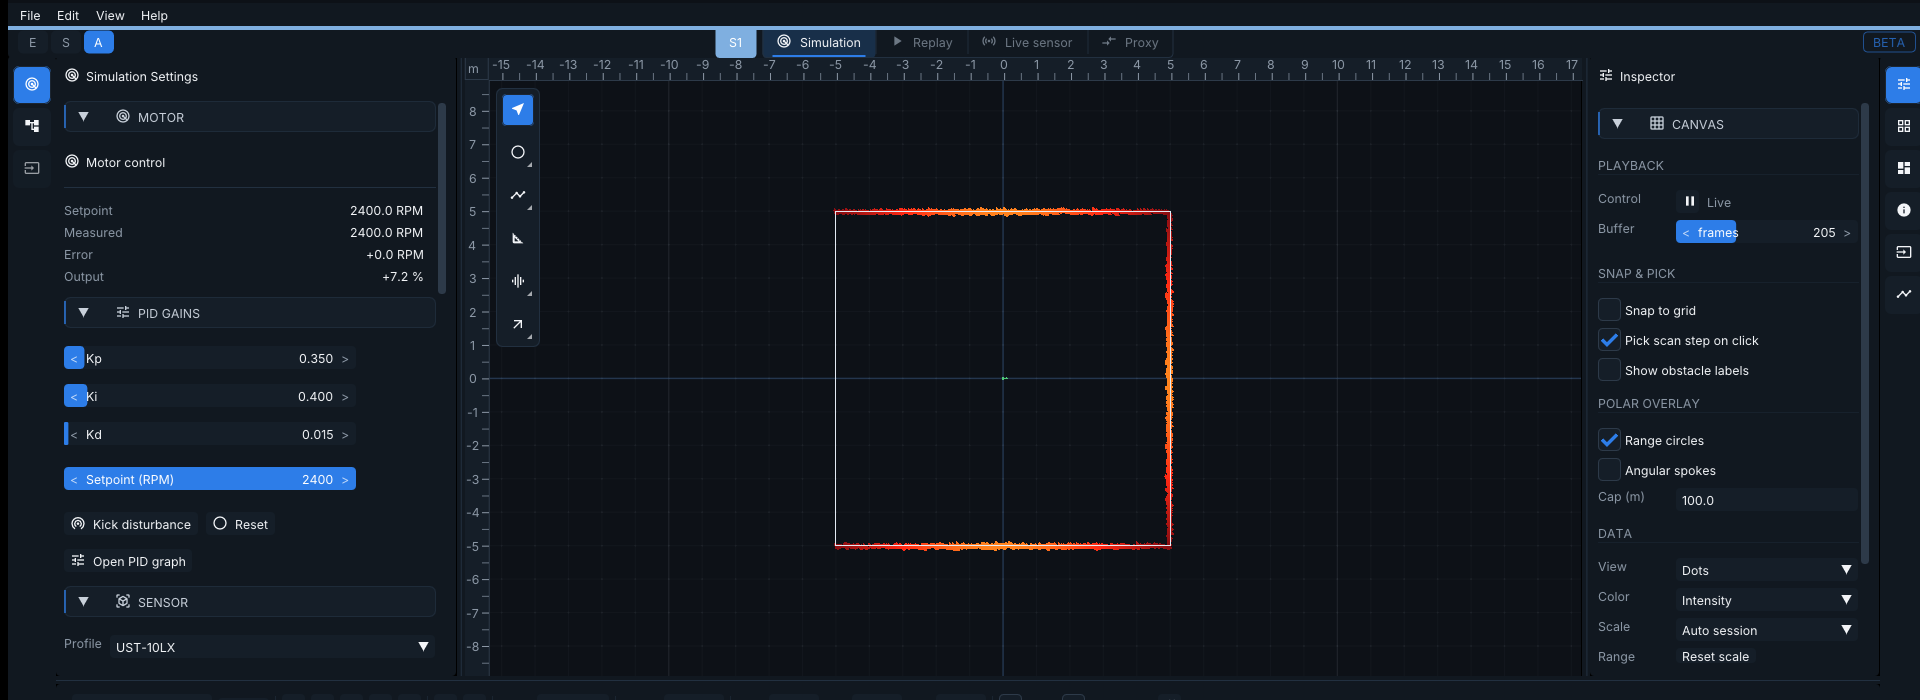
RangeFinder Studio keeps simulation, capture review, live gateway work, and proxy operation in one desktop environment.
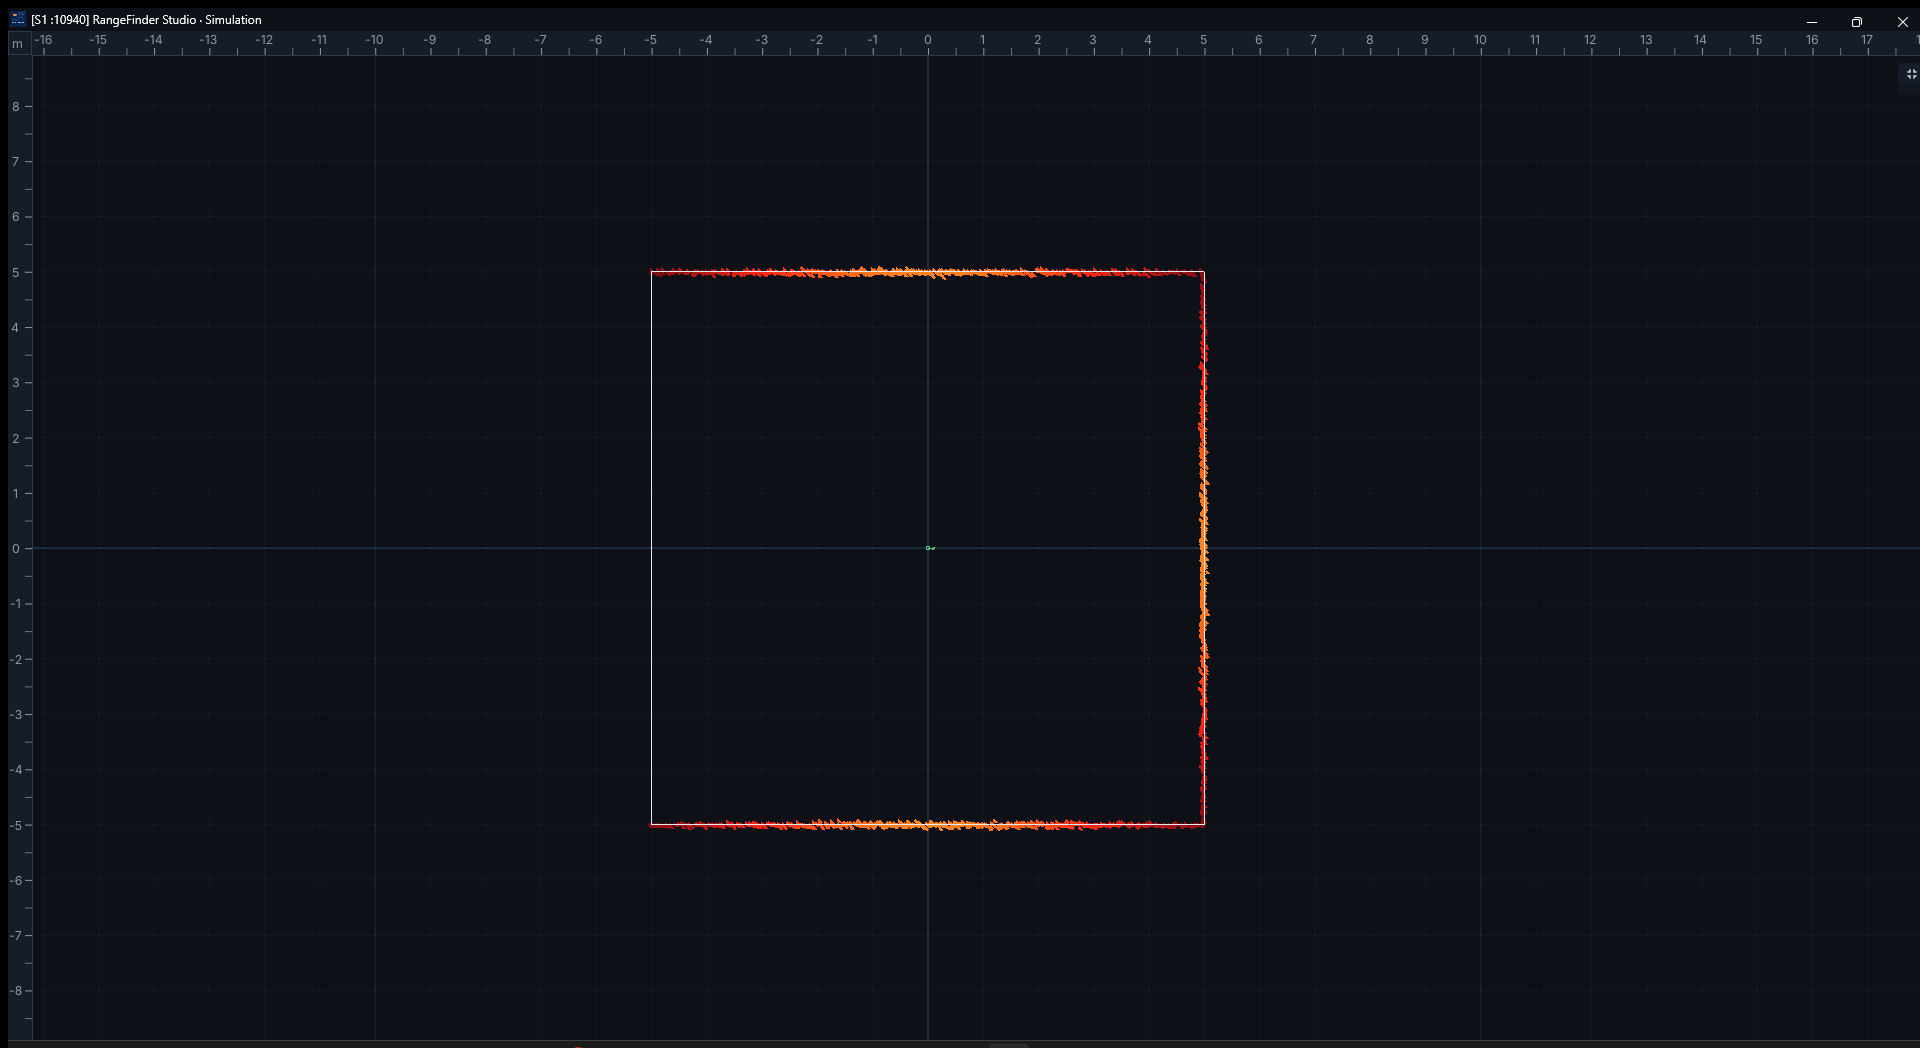
Build a scene, point a virtual UST-10LX at it, and capture deterministic scan data. Use it to develop ingestion code, exercise edge cases, or stand up a demo without waiting for a sensor seat.
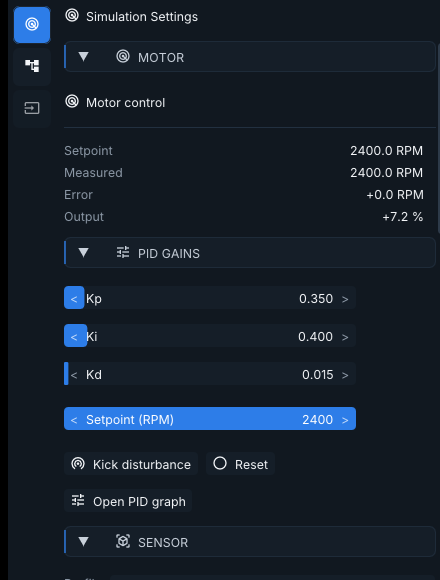
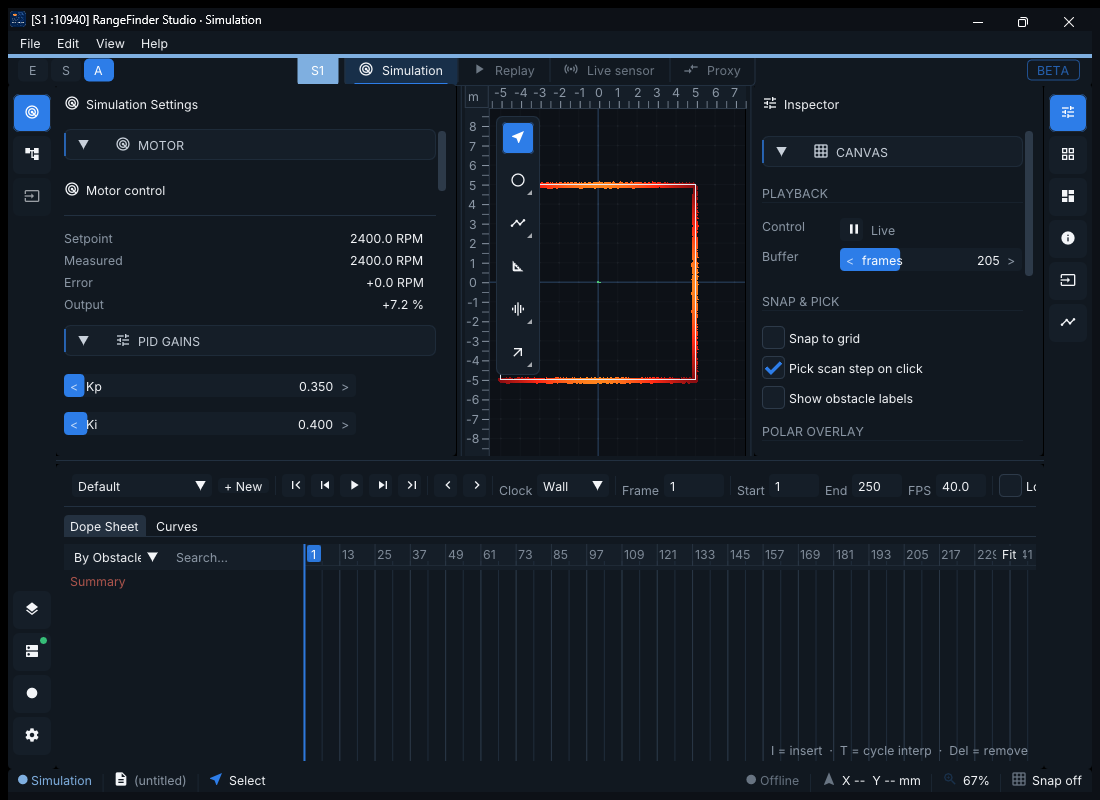
Adjust setpoint and PID gains while a scene is playing. Kick the rotor with a disturbance to confirm the controller recovers, then open the PID graph for a frame-accurate trace.
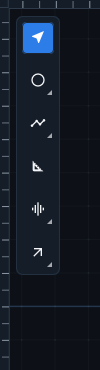
Drop obstacles, detection ellipses, polylines, rectangles, and arrows directly on the polar canvas. Tools live in a vertical palette that stays out of the scan area until you reach for them.
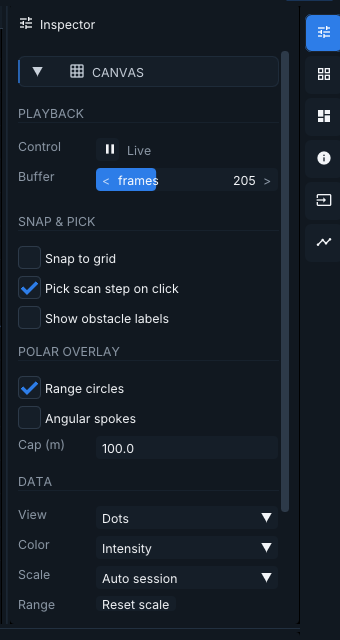
The Inspector groups playback, snap and pick, polar overlay, and data view controls in one collapsible panel. Switch render mode, intensity coloring, or axis scale without leaving the canvas.
Move, scale, and toggle obstacles over time on a dope sheet identical in spirit to a NLE. Loop the timeline at 40 Hz, scrub with the arrow keys, or jump to a named keyframe with the playback bar.

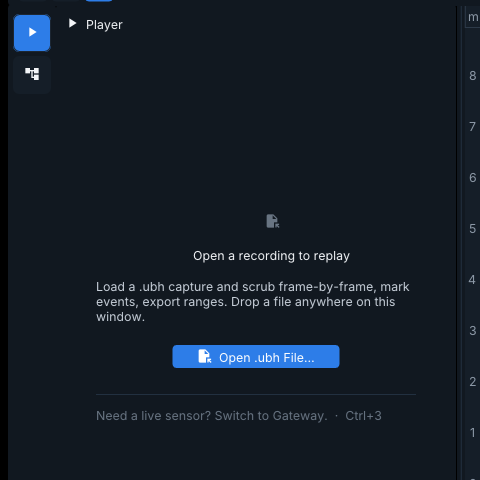
Open a .ubh capture, scrub frame by frame, and select individual points to read range, angle, and intensity. Compare two runs side by side when you need to explain a regression with concrete data, not anecdotes.
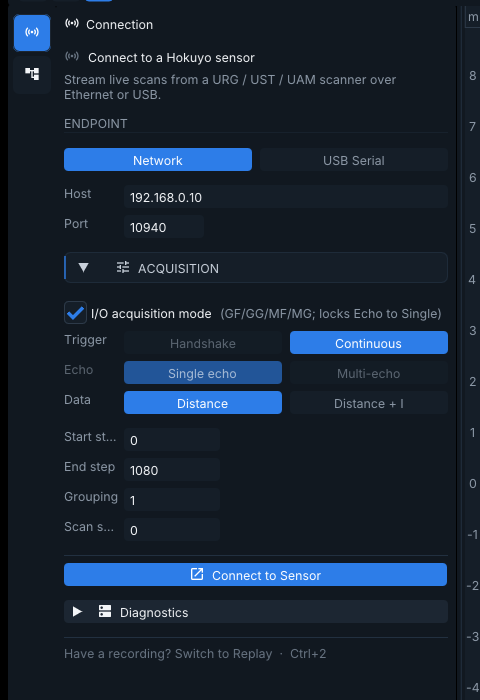
Configure the host and port, pick handshake or continuous trigger, single or multi echo, distance or distance + intensity. I/O acquisition mode wires the GF / GG / MF / MG commands end to end.
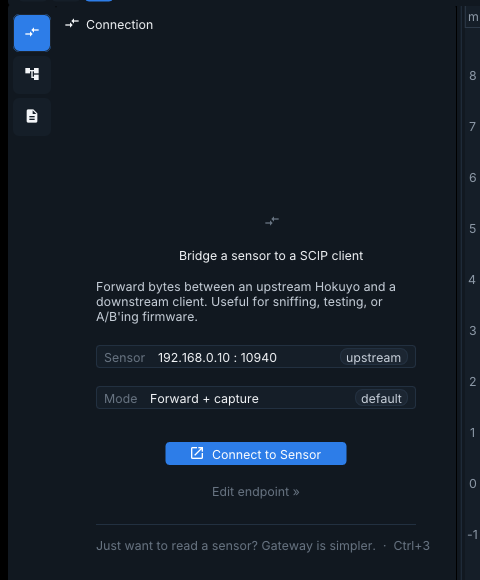
Forward bytes between an upstream Hokuyo and a downstream client. Useful for sniffing protocol traffic, A/B testing firmware, or capturing while a third party tool drives the sensor.
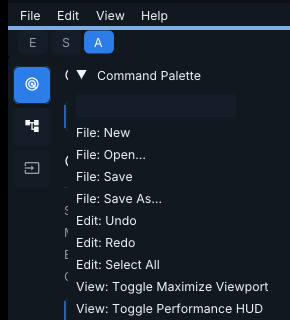
A fuzzy palette covers file, edit, view, workspace, recording, annotation, tools, and panel actions. Faster than hunting menus, and identical across every workspace.
The full workspace, including motor panel, canvas, inspector, and dope sheet, collapses cleanly down to a narrow desk display. Side rails stay reachable; no horizontal scroll, no clipped controls.
Reproduce a bug from a captured frame, confirm the fix against the same data, and hand a teammate the file plus the frame index. No screen-share spelunking required.
For live sensors, an optional local AI explains error codes and device state in plain language, running entirely on your machine. See local AI diagnostics
| Application engineers | Prototype data paths and verify behaviour before a deployment reaches the field. |
|---|---|
| Integration teams | Compare offline captures with live sensor behaviour while tuning a system. |
| Support engineers | Inspect shared captures, reproduce reported issues, and explain the cause with frames. |
One installer. Sim, replay, and live gateway in one place.